
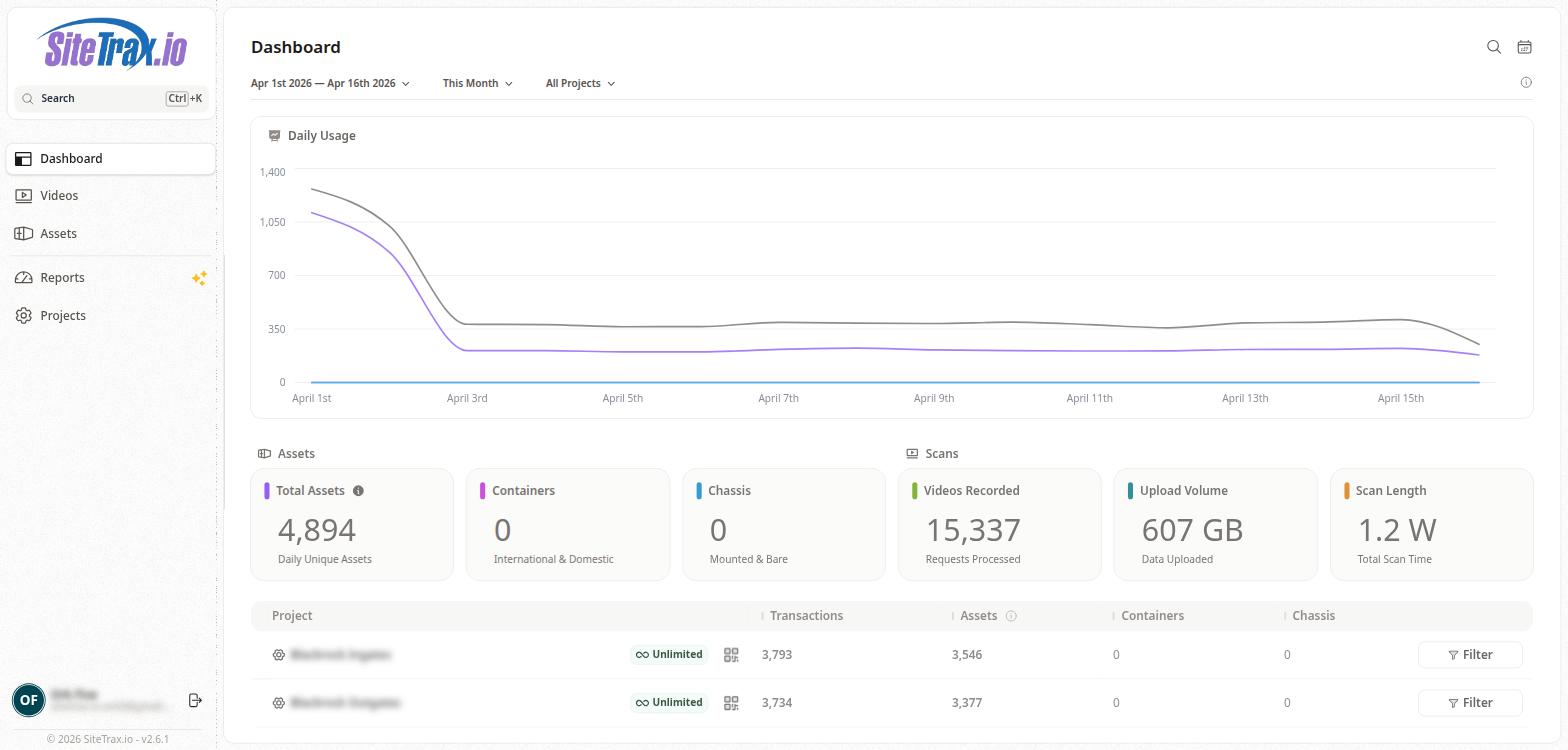
Daily Usage Chart
Retired page. This documents the legacy SiteTrax.io service portal, which has been replaced by SiteTrax.io Intelligence at app.sitetrax.io. It is kept for reference only and is no longer maintained. For current guidance, see the SiteTrax.io Intelligence shelf.
The Daily Usage section displays a line chart that visualizes activity over the selected date range. The horizontal axis represents calendar days, and the vertical axis represents the count of activity (such as scans or assets processed). The chart provides a quick visual indicator of operational volume trends, helping users identify peak activity days or periods of reduced scanning.
No comments to display
No comments to display