
Executive Reporting

Producing volume and activity numbers that hold up when someone asks where they came from.
In the application
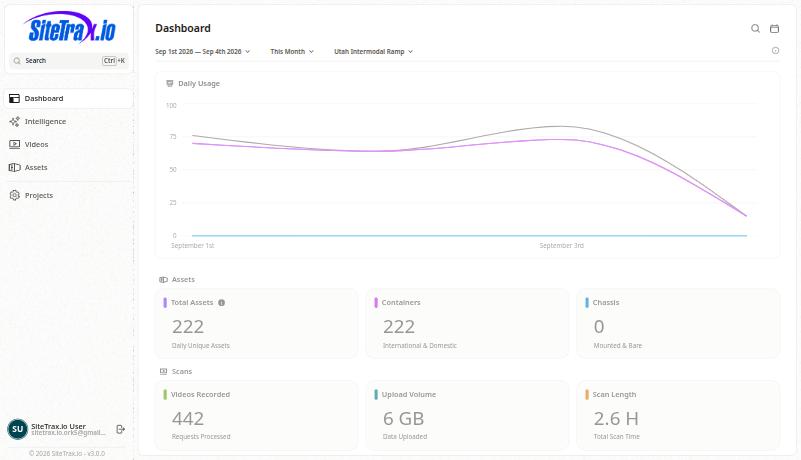
The dashboard is the reporting surface. Set the date range, the period and the project, and read:
- Daily usage as a trend across the period.
- Assets: total assets, containers, and chassis.
- Scans: videos recorded, upload volume, and total scan time.
From an assistant
Using SiteTrax.io, compare container volume across my sites for the last two months and show the month-over-month change.
Using SiteTrax.io, break last month down by project and asset type.
Aggregation happens on the SiteTrax.io server, so the assistant can request a summary without downloading every underlying record. The requested result is returned to the assistant provider you connected. Ask for supporting records when a figure needs to be explained.
The query returns whole-window totals separately from the displayed groups. A capped group list may be partial while the totals remain exact. Request a narrower scope or coarser grouping before presenting a full breakdown. Do not add distinct counts across overlapping groups or combine percentiles; ask the server for the required overall measure.
Make the number defensible
- State the filters.
EveryPublishfiguretheis a function ofresolved daterange,bounds,periodtimezone, projects, equipment types, status eligibility andproject. Publish themmeasure alongsidetheeachnumber.figure. Ordinary MCP date filters use UTC business days even when time buckets are displayed in another timezone. - Say what is being counted. Stored
readingsrows, distinct recorded identifiers anddistinctcompletedidentifierspaired visits are differentmeasures,measures.andDistinct identifiers across projects or days are not generally additive: thedifferencesamewillidentifierbecannoticed.occur in several groups. - Note coverage changes. A camera added or lost mid-period moves the volume line for reasons that have nothing to do with the business.
- Keep a path back to the record. A reviewer should be able to open an individual observation.
Watch out for
AInvestigate a volumedrop can be a capture failure.drop.CheckCompare camerahealthactivity, first/last observations andvolumevolume-gapgapssignals beforereportingattributing a declineastooperational.operations. Low volume alone does not diagnose a camera outage.- Do not mix measures across periods. Compare like with like.
- Scan time and upload volume describe capture, not throughput. They are useful for health, not for business performance.
For a recurring report, ask for a scheduled aggregate digest delivered to your verified SiteTrax.io account email. Confirm the projects, measure, reporting window, schedule, timezone and expiry before creation. Creating or cancelling it needs the additional notification-write permission; reading its status and delivery history needs read permission only. See Alerts and scheduled digests.